According to a Pew Research Center survey, 85% of Americans say they go online on a daily basis, with 31% reporting that they go online “almost constantly.”
With people spending more time online than ever before, it’s important that your website is optimized for visitors to browse and stick around. But longer isn’t necessarily better. You want visitors to stay on your website because they’re enjoying the content and experience — not because they can’t find the information that they’re looking for or can’t complete a desired action, like making a purchase.
In this post, we’ll cover what a “good” average time on page and average session duration benchmark is, and how to improve these metrics on your website.
Average Time On Page Benchmark
According to Contentsquare’s 2021 Digital Experience Benchmark report, the average time on page across all industries is 54 seconds. While you can use that as a benchmark, meeting it doesn't necessarily mean your average time on page is optimal.
Like page views, bounce rate, and other website metrics, average time on page is contextual. What’s “good” depends on the type of website you have, the industry you’re in, and the web page you’re tracking, among many other factors.
For example, in their 2021 Digital Experience Benchmark report, Contentsquare analyzed data
from over 20 billion user sessions from across the globe. They were able to track average time on page across 10 industries, and found major differences.
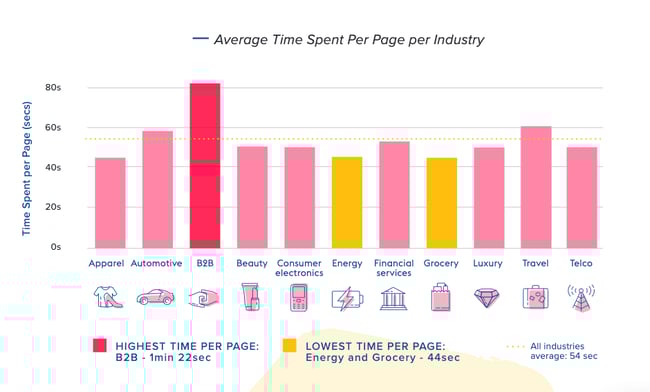
B2B, for example, had the highest average time spent on page with 1.37 minutes. This was at least 20 seconds higher than the other industries. The industries on the other end of the spectrum were grocery and energy, with an average time spent per page of 44 seconds. This gap emphasizes the importance of using an average time on page benchmark that’s specific to your industry.
A “good” average time on page also depends on the type of content. For example, you ideally want visitors spending more time on your product pages and blog posts. In fact, in a survey by Databox, 45% of respondents said that the average time on page for their blog posts is 3-5 minutes. A higher time on page indicates that the content is relevant, easy to read and understand, and targeted at the right audience.
On landing and checkout pages, however, higher time on page could mean that there are obstacles to conversion. The content, CTAs, or form might be confusing, for example.
Average Time on Page Google Analytics
Google Analytics is one of the most widely used tools to measure average time on page, among other performance metrics. It’s therefore important to explain how Google Analytics calculates this metric.
Google Analytics tracks average time on page by measuring the difference between the timestamps of hits. That means if a user lands on a web page and then closes their browser window or tab, or types another URL into their address bar, their visit is not counted.
So average time on page is calculated from the non-exits and non-bounces only, which is a smaller percentage than the total hits for a page.
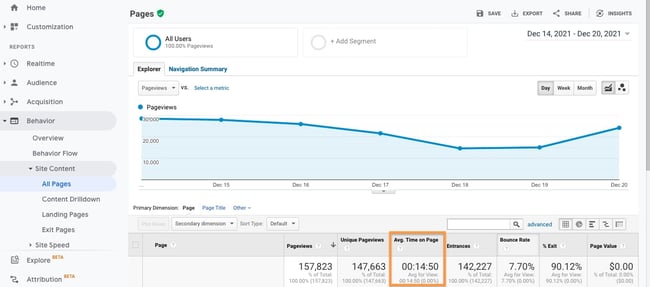
That’s why this average is typically higher than average session duration, which we’ll talk about more in the next section.
Google Analytics also keeps tracking time on page even if the user’s browser window or tab is hidden. So while this metric is not the most accurate, it is still a valuable indicator of how engaging and effective your content is.
Now that we have a better understanding of how to calculate and benchmark the average amount of time users spend on individual pages, let’s take a look at how to figure out how long visitors are spending on your entire website.
Average Time Spent on a Website
Average time spent on a website, like average time on page, is dependent on a range of factors. Industry, the type of website, and even the device that users are on impact this average.
For example, Statista calculated the 20 most popular websites worldwide as of June 2021, by time per visit. Users spent approximately 22 minutes and 44 seconds per visit on Google, the most popular website, and only .54 minutes on VK.com, the 20th most popular.
To calculate how long visitors are staying on average on your entire website instead of individual web pages, look at average session duration.
Average session duration measures the average length of sessions on a website. Google Analytics begins counting the length of a session from the time the user lands on a site until the user exits the site, or is inactive for a predetermined amount of time. (In Google Analytics, a session can last for up to 30 minutes without a user interacting with your pages.)
That means a session can consist of a user viewing a single page or viewing multiple pages, and can range anywhere from a few seconds to a few hours.
Average session duration is calculated as: total duration of all sessions (in seconds) / number of sessions.
This is a key difference between average time on page and average session duration. Whereas average time on page excludes visits that end in exits or bounces, average session duration counts all bounces as zero seconds. This can lower the average session duration significantly if your website has a high bounce rate.
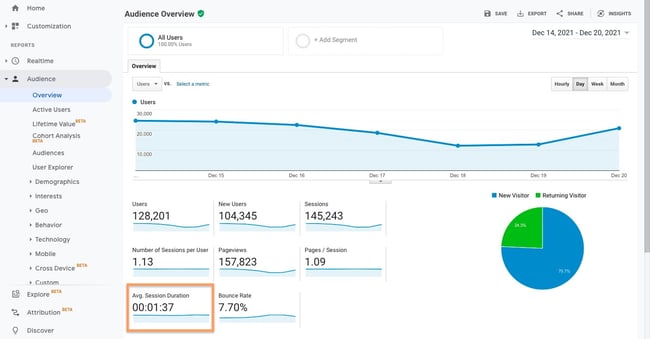
The Google Analytics dashboard below, for example, is tracking the same website as above. So while its average time on page last week was 14 minutes and 50 seconds, its average session duration was 1 minute and 37 seconds.
To improve average session duration, or the average time spent on a website, try the best practices below.
1. Decrease load time.
Decreasing load time can help reduce your site’s bounce rate, which can significantly improve average session duration.
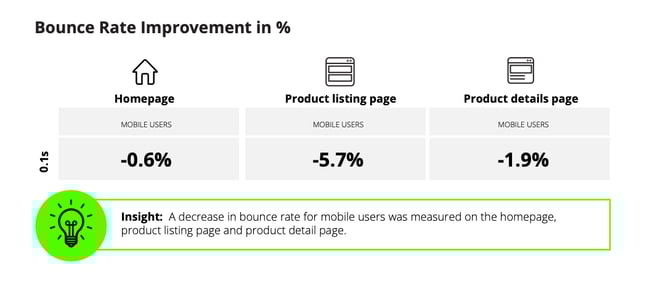
In a study commissioned by Google and conducted by 55 and Deloitte, decreasing mobile site load times by just one tenth of a second resulted in significant decreases in bounce rate: 0.6% for homepages, 5.7% for product listing pages, and 1.9% for product details pages.
Using a CDN, optimizing images, reducing redirects, and compressing files are just a few ways to decrease load time. To learn more, check out our full guide on optimizing your website speed.
2. Optimize your navigation.
Website navigation enables visitors to quickly and easily find the information they're looking for, like a blog post, and important information that they weren’t looking for, like pricing info. A good navigation system can improve the chances of visitors taking action and browsing your site longer.
When designing a navigation menu, follow these best practices:
- Put your most important items at the beginning of the navigation menu.
- Use navigation labels that align with your type of business and are SEO-optimized.
- Include a search box.
- Add navigation links in the header, sidebar, and footer of your site.
3. Add internal links.
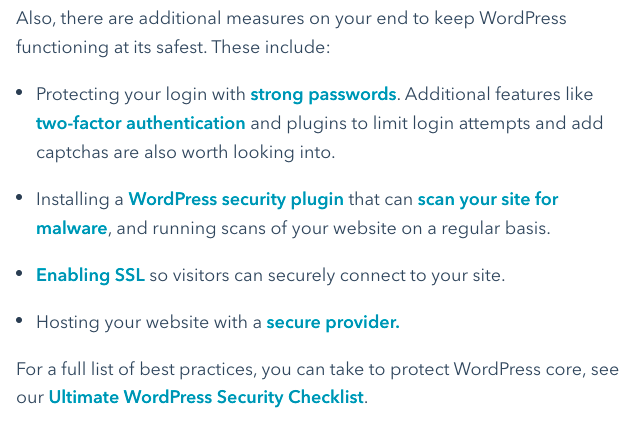
Another way to enable visitors to easily find and read relevant content on your site is adding internal links. Internal linking makes your site easier to navigate, which increases the chances that readers look at more content and stay on your site longer.
Here’s an example of a blog post with lots of internal links encouraging visitors to dive into these subtopics in more depth:
4. Improve the readability of your posts.
When evaluating the readability of your content, you need to consider what the words are on the page and how they look.
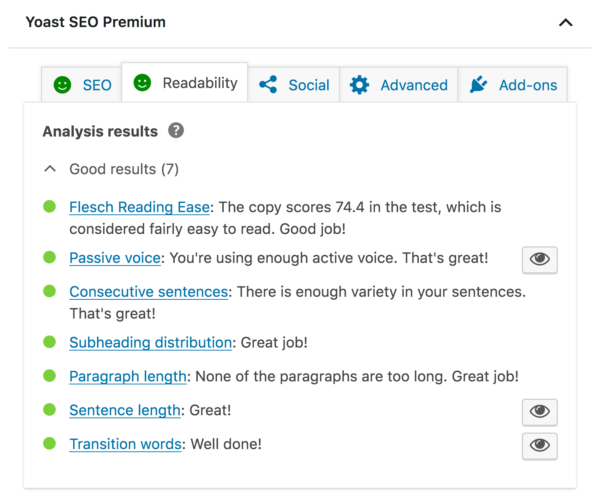
To improve the flow of the post, remove any instances of passive voice, shorten long sentences or paragraphs, and add transition words. To improve the look of the post, try adding headings, subheadings, and bullet points to break up chunks of texts. Also make sure you’re using an easy-to-read font and accessible color scheme.
A tool like Yoast SEO can help automate this process. In fact, it has a readability analysis tab where it provides actionable feedback to make your post or page easier to read.
5. Add images and videos.
Adding multimedia content, like images, videos, and infographics, is another way to improve the readability of your content. Not only do they break up chunks of text — they can also illustrate complicated ideas (like APIs, for example) and appeal to different types of learners.

Images and videos enhance the overall user experience and encourage visitors to stay on the page longer.
6. Optimize for all devices.
According to a study by Perficient, 68.1% of all website visits globally in 2020 came from mobile devices and only 28.9% and 3.1% came from desktops and tablets, respectively. However, desktops drove 46.4% of total time on site globally and tablets drove more total time on site than mobile devices.
This emphasizes the importance of having a fully responsive website that’s optimized for all devices. Sizing and styling buttons, SVGs, images, and fonts are especially important when creating a responsive site. For more best practices, check out our complete guide to responsive web design.
7. Use exit intent popups.
Exit intent popups appear when a visitor is about to bounce from a website. These contain an offer or message that’s designed to keep them on the page. Briogeo, for example, has an exit intent popup encouraging visitors to take their hair quiz before leaving the site.

While this won’t convince every visitor to stay, it may convince some, which will ultimately help improve your average session duration.
Encouraging Visitors to Stay on Your Site
Average time on page and average session duration are excellent indicators of how engaging and effective your content is and whether you’re attracting quality traffic. Now that you understand what these metrics mean and what benchmarks to use to evaluate your performance, you can focus on optimizing your site to have visitors browse for longer.
Editor's note: This post was originally published in March 2014 and has been updated for comprehensiveness.
What Is the Average Time Spent On a Website? [+ How to Improve It] was originally posted by Local Sign Company Irvine, Ca. https://goo.gl/4NmUQV https://goo.gl/bQ1zHR http://www.pearltrees.com/anaheimsigns


No comments:
Post a Comment